
When you're collecting and logging critical industrial data, losing any of it usually isn't an option — which means you need to know, 24/7, that the application itself is running smoothly, and to find out immediately the moment something isn't. Idako 4.3.2 added exactly that: a comprehensive set of health metrics exposed through the /health endpoint in Prometheus format, the industry standard for monitoring — letting you plug in a monitoring agent to watch every component and get notified the instant something goes wrong.
This guide walks through wiring that endpoint into NetData: two of its built-in collectors read /health — one that works today with zero setup, another that unlocks per-component and per-server detail once you're on Idako 4.3.2 — and NetData's own alerting emails you the moment something breaks. Nothing new to run: if a NetData agent is already watching this host, this uses it as-is.
Get the config files
Download the ready-to-copy config files and unzip them as a folder named idako-netdata — four small files that plug into a NetData install you already have, nothing built from scratch. Two are collector job files (where to look), two are matching alert rule files (what counts as a problem):
httpcheck (step 2) works against /health exactly as it is today, on any Idako version, and is what reliably catches the instance being completely unreachable. The prometheus collector (step 3) needs Idako 4.3.2's /health?format=prometheus and unlocks per-component status and per-server detail. Run both side by side — one isn't a replacement for the other.Point httpcheck at Idako
Open go.d/httpcheck.conf — it polls /health with a plain HTTP request and checks for a 200 response containing "status":"OK". The only thing to adjust is the target address:
update_every: 5

jobs:
  - name: idako_local
    url: http://idako-host:4880/health
    status_accepted: [200]
    response_match: '"status"\s*:\s*"OK"'
    timeout: 3
Replace idako-host and 4880 with your Idako instance's actual host and port. The job's name matters too: it becomes the chart family NetData groups this check under, and it's what the alert rules in step 4 match against by the idako_ prefix — keep that prefix if you rename it.
Add richer metrics via Prometheus
Idako 4.3.2 also exposes /health in Prometheus's own text format, via a query parameter — the same format the Idako + Grafana guide reads with a dedicated Prometheus server, read here instead by NetData's own prometheus collector. Where httpcheck only tells you up or down, this charts every subsystem individually: the OPC UA collector engine, the local buffer, the tsdb connection, and each configured server by name.
update_every: 10

jobs:
  - name: idako_local
    url: http://idako-host:4880/health?format=prometheus
    app: idako
    expected_prefix: idako_
    max_time_series: 500
Same host/port substitution as step 2. app: idako groups the resulting charts under a predictable name in the dashboard; expected_prefix is a guard rail against accidentally scraping something that isn't Idako.
app: setting. The alert rules in the next step already use the documented pattern (prometheus.idako.<metric>), but it's worth a one-time check once data is flowing: curl -s http://localhost:19999/api/v1/contexts | grep idako.Install the alert rules
Two files, one per collector from steps 2–3, written as templates — a template attaches to every matching chart automatically, so adding a second Idako instance later (see "Monitoring more than one instance") needs no changes here.
Reachability — pairs with httpcheck
template: idako_health_unreachable
      on: httpcheck.status
 families: idako_*
   lookup: average -1m unaligned percentage of success
    units: %
    every: 10s
     warn: $this < 100
     crit: $this < 50
    delay: down 30s multiplier 1.5 max 2m
     info: percentage of /health checks that succeeded (HTTP 200 + status:OK) in the last minute
       to: sysadmin

template: idako_health_response_slow
      on: httpcheck.response_time
 families: idako_*
   lookup: average -1m unaligned
    units: ms
    every: 10s
     warn: $this > 2000
     crit: $this > 5000
    delay: down 1m multiplier 1.5 max 5m
     info: average response time of Idako's /health endpoint over the last minute
       to: sysadmin
families: idako_* scopes both templates to job names starting with idako_, so they won't fire on unrelated httpcheck jobs running on the same agent.
Component health — pairs with the Prometheus collector
template: idako_up_prom
      on: prometheus.idako.idako_up
   lookup: average -2m unaligned
    units: ratio
    every: 10s
     warn: $this < 1
     crit: $this == 0
    delay: down 30s multiplier 1.5 max 2m
     info: Idako reports overall status OK
       to: sysadmin

template: idako_collector_up_prom
      on: prometheus.idako.idako_collector_up
   lookup: average -1m unaligned
    units: ratio
    every: 15s
     warn: $this < 1
    delay: down 30s multiplier 1.5 max 2m
     info: Idako's OPC UA collector engine is not running
       to: sysadmin

template: idako_collector_disconnected_servers_prom
      on: prometheus.idako.idako_collector_disconnected_servers
   lookup: min -1m unaligned
    units: servers
    every: 30s
     warn: $this > 0
    delay: down 30s multiplier 1.5 max 2m
     info: one or more configured, active OPC UA servers are disconnected
       to: sysadmin

template: idako_collector_server_down_prom
      on: prometheus.idako.idako_collector_server_up
   lookup: min -1m unaligned foreach *
    units: ratio
    every: 30s
     warn: $this < 1
    delay: down 30s multiplier 1.5 max 2m
     info: this OPC UA server connection is not OK
       to: sysadmin

template: idako_collector_bad_variables_prom
      on: prometheus.idako.idako_collector_bad_variables
   lookup: average -1m unaligned
    units: variables
    every: 30s
     warn: $this > 0
     crit: $this > 100
    delay: down 1m multiplier 1.5 max 5m
     info: variables reporting bad quality, summed across the whole fleet
       to: sysadmin

template: idako_buffer_up_prom
      on: prometheus.idako.idako_buffer_up
   lookup: average -1m unaligned
    units: ratio
    every: 15s
     warn: $this < 1
    delay: down 30s multiplier 1.5 max 2m
     info: Idako's local buffer subsystem is not running
       to: sysadmin

template: idako_buffer_values_lost_prom
      on: prometheus.idako.idako_buffer_values_lost
   lookup: sum -5m unaligned incremental
    units: values
    every: 1m
     warn: $this > 0
    delay: down 1m multiplier 1.5 max 5m
     info: values could not be stored in the local buffer and were lost in the last 5 minutes
       to: sysadmin

template: idako_tsdb_down_prom
      on: prometheus.idako.idako_tsdb_up
   lookup: average -1m unaligned
    units: ratio
    every: 15s
     warn: $this < 1
    delay: down 30s multiplier 1.5 max 2m
     info: Idako's connection to the time-series database is not OK
       to: sysadmin

template: idako_tsdb_batches_failed_prom
      on: prometheus.idako.idako_tsdb_batches_failed
   lookup: sum -5m unaligned incremental
    units: batches
    every: 1m
     warn: $this > 0
    delay: down 1m multiplier 1.5 max 5m
     info: batches of values failed to forward to the tsdb in the last 5 minutes
       to: sysadmin
| Rule | Fires when | Severity |
|---|---|---|
| Idako unreachable | httpcheck stops getting HTTP 200 + status:OK | warning → critical |
| /health responding slowly | average response time > 2s (warn) / 5s (crit) | warning / critical |
| Idako reports not OK | idako_up is 0 | critical |
| Collector engine down | idako_collector_up is 0 | warning |
| OPC UA server disconnected | idako_collector_server_up is 0 — one alert per server | warning |
| Bad variables detected | idako_collector_bad_variables > 0 (warn) / > 100 (crit) | warning / critical |
| Local buffer down | idako_buffer_up is 0 | warning |
| Values lost | idako_buffer_values_lost > 0 in the last 5m | warning |
| TSDB down | idako_tsdb_up is 0 | warning |
| TSDB batch failures | idako_tsdb_batches_failed > 0 in the last 5m | warning |
httpcheck.status always writes a real 0 the moment a request fails outright — connection refused, timeout, wrong status code. idako_up_prom only evaluates once NetData has parsed a fresh Prometheus scrape; if the /health call fails completely, there's no idako_up sample to evaluate at all — a gap, not a 0 — and NetData's alarm engine doesn't reliably treat a gap as a failure. Keep both rules active: idako_health_unreachable catches "completely gone," idako_up_prom catches "up, but internally unhealthy."Set the alert recipient
Every rule above ends in to: sysadmin — that's a role, not an address. NetData maps roles to real recipients in one file that (like Grafana's SMTP settings) isn't part of what you downloaded, since it holds where alerts actually go rather than what counts as a problem:
cd /etc/netdata
sudo ./edit-config health_alarm_notify.conf
Set (or confirm) these values:
SEND_EMAIL="YES"
EMAIL_SENDER="alerts@example.com"
DEFAULT_RECIPIENT_EMAIL="you@example.com"
DEFAULT_RECIPIENT_EMAIL is where every to: sysadmin alarm above goes, since sysadmin is NetData's built-in default role. To send Idako's alerts to a different address than everything else on this host, set role_recipients_email[sysadmin]="you@example.com" instead — it overrides the default for just that one role.
health_alarm_notify.conf hands the message to the system's own sendmail-compatible command to actually deliver it. If this host doesn't already send outbound mail, point it at a relay or install a local MTA first — that's a host-level prerequisite this file can't provide on its own.C:\Program Files\Netdata\etc\netdata\health_alarm_notify.conf — edit it from the bundled MSYS2 shell (C:\Program Files\Netdata\msys2.exe) as Administrator, since edit-config is a bash script and Program Files needs elevation to write to.Turn it on
Three mechanical steps: confirm both collectors are enabled, copy the four files from step 1 into NetData's live config directory, and restart.
Enable the collectors
Both ship with default_run: yes, so this is usually a check, not a change:
cd /etc/netdata
sudo ./edit-config go.d.conf
# confirm under modules:
#   httpcheck: yes
#   prometheus: yes
cd /etc/netdata && ./edit-config go.d.conf.Copy the files in
sudo cp go.d/httpcheck.conf     /etc/netdata/go.d/
sudo cp go.d/prometheus.conf    /etc/netdata/go.d/
sudo cp health.d/idako-httpcheck.conf   /etc/netdata/health.d/
sudo cp health.d/idako-prometheus.conf  /etc/netdata/health.d/
Copy-Item the same four files into C:\Program Files\Netdata\etc\netdata\go.d\ and ...\health.d\ respectively.Restart
sudo systemctl restart netdata
Restart-Service Netdata from an elevated PowerShell (or Services → Netdata → Restart).Confirm it's working
Open http://localhost:19999 (or your NetData host's address) — NetData's own dashboard, no separate login to set up.
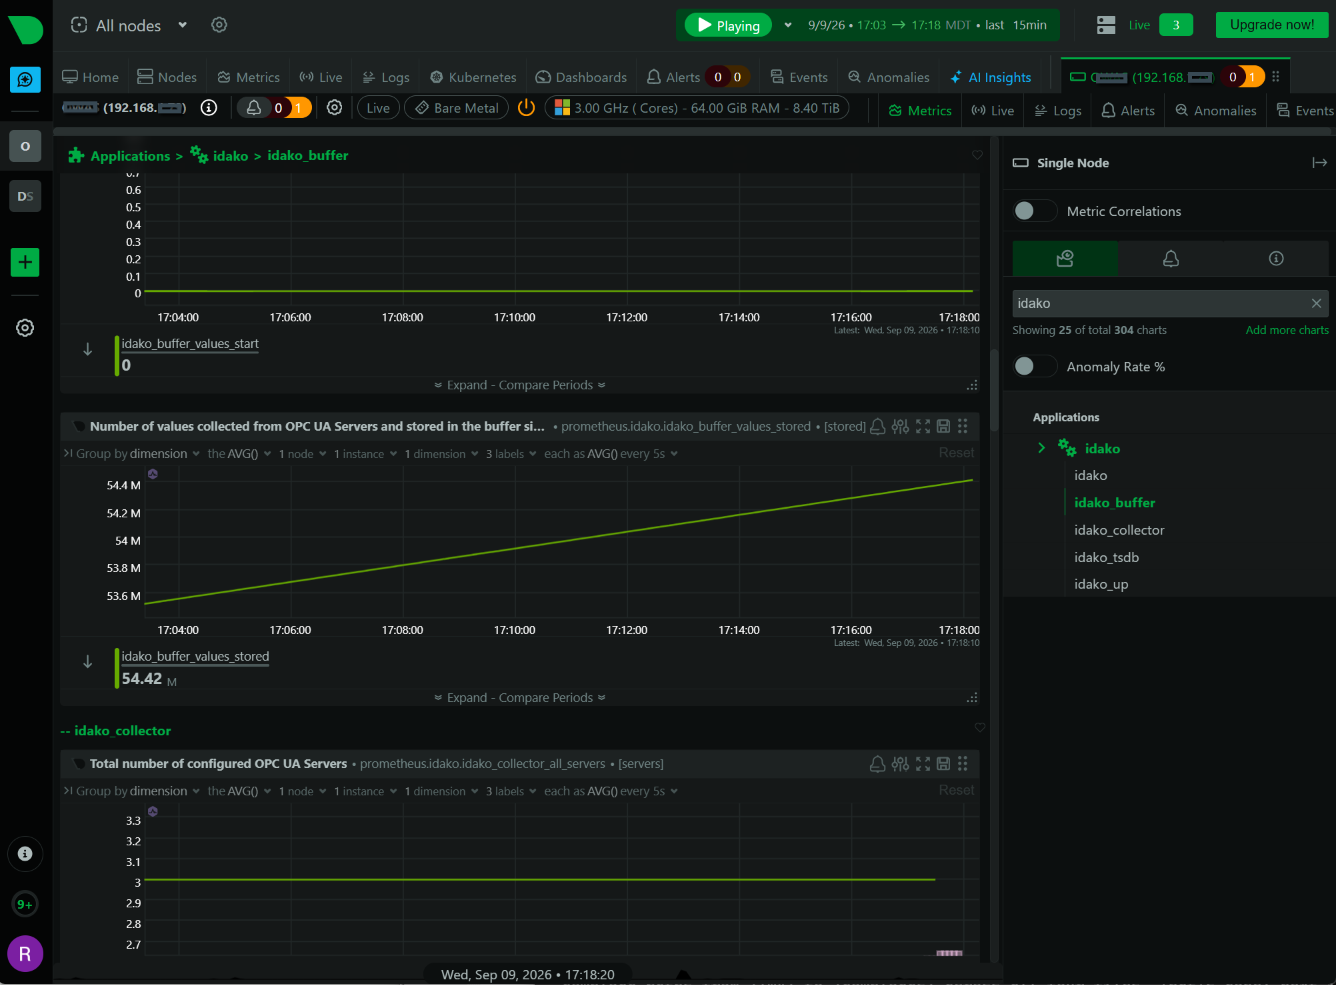
Look for an idako section in the left-hand menu. httpcheck's status and response-time charts should appear within a few seconds of restarting; the Prometheus-collector charts (per-component status, per-server detail) appear once step 3's job has scraped at least once. It should look something like this:
curl -s http://idako-host:4880/health?format=prometheus and revisit the one-time context-name check from step 3.Monitoring more than one Idako instance
Add one more job to each collector file — nothing else changes, since every alert rule from step 4 is a template (or already scoped with families: idako_*) that automatically covers every matching job:
  - name: idako_site_b
    url: https://idako-site-b.example.com/health
    status_accepted: [200]
    response_match: '"status"\s*:\s*"OK"'
    timeout: 3
  - name: idako_site_b
    url: https://idako-site-b.example.com/health?format=prometheus
    app: idako
    expected_prefix: idako_
    max_time_series: 500
Restart NetData to pick up the new jobs — unlike a health.d-only change, adding a job needs a full restart, not just reload-health.
Verifying the alerts actually work
A clean restart only proves NetData accepted the config, not that a real notification gets delivered. Two checks worth doing once, right after setup:
- Send a test notification — NetData ships a self-test for exactly this:
sudo /usr/libexec/netdata/plugins.d/alarm-notify.sh testsends a real test message through every configured method,sysadminincluded. Confirms step 5's settings actually deliver, before any real alarm depends on them. - Trigger a real one — stop Idako (or block the port) and wait a minute or two.
idako_health_unreachableshould move to warning, then critical, and an email should follow shortly after. Bring Idako back and you should get a second, "recovered" notification once it clears.
alarm-notify.sh test doesn't deliver either, it's a mail-transport problem on this host, not a config problem with the rules themselves.Where to go from here
| Want fuller dashboards and PromQL-based alerting? | The Idako + Grafana guide reads this same /health?format=prometheus endpoint with a dedicated Prometheus server and a Grafana dashboard — heavier to run, more powerful to query. |
| Detailed charts before every instance is on 4.3.2 | NetData's pandas collector can read the plain JSON /health body as a bridge — Linux-only in practice; confirm python.d.plugin and a Python 3 + pandas/requests environment before relying on it. |
| Route alerts to more than email | health_alarm_notify.conf supports Slack, PagerDuty, and a long list of other methods alongside email — same to: sysadmin roles, more delivery options per role. |
| See exactly what Idako reports | The full field-by-field reference for /health, including every metric this guide's charts and alerts are built from. |