
When you're collecting and logging critical industrial data, losing any of it usually isn't an option — which means you need to know, 24/7, that the application itself is running smoothly, and to find out immediately the moment something isn't. Idako 4.3.2 added exactly that: a comprehensive set of health metrics exposed through the /health endpoint in Prometheus format, the industry standard for monitoring — letting you plug in a tool like Grafana to watch every component and get notified the instant something goes wrong.
This guide walks through a self-hosted monitoring stack you run in Docker: Prometheus scrapes that health data, Grafana turns it into a live dashboard — and emails you the moment something breaks. No cloud account, no agents to install on the Idako host itself.
Get the project folder
Download the complete configuration and unzip it as a folder named idako-monitoring — everything below lives in that one folder, so the whole stack can be started, stopped, and moved as a unit. You'll adjust a handful of values inside it (your Idako host/port, SMTP details, alert recipient) over the next few steps; nothing needs to be built from scratch. Here's what's inside:
.env. That file holds your real SMTP password and isn't included in the download — step 4 has you create it yourself from .env-example, and .gitignore (also from step 4) keeps it out of version control.Point Prometheus at Idako
Open prometheus/prometheus.yml — it tells Prometheus what to scrape and how often, requesting Idako's health data in Prometheus format via a query parameter. The only thing to adjust is the target address:
global:
  scrape_interval: 15s

scrape_configs:
  - job_name: idako
    metrics_path: /health
    params:
      format: [prometheus]
    static_configs:
      - targets: ["idako-host:4880"]
Replace idako-host and 4880 in targets with your Idako instance's actual host and port — that's the only edit this file needs.
host.docker.internal only if your Docker version maps it (add extra_hosts: ["host.docker.internal:host-gateway"] under the prometheus service in step 5 if needed) — on Docker Desktop for Windows/Mac it works out of the box.Provision the Grafana dashboard
Instead of clicking through Grafana's UI to add a data source and build panels by hand, three files already sitting in grafana/provisioning/ do it automatically, the same way every time you start the stack. Here's what each one does — none of them need editing.
Connects Grafana to Prometheus
apiVersion: 1

datasources:
  - name: Prometheus
    uid: prometheus
    type: prometheus
    access: proxy
    url: http://prometheus:9090
    isDefault: true
http://prometheus:9090 works because Docker Compose puts both containers on the same network and lets them reach each other by service name — there's nothing to substitute here. The explicit uid: prometheus matters more than it looks: the dashboard panels below and the alert rules in step 4 both reference the datasource by this exact id, so pinning it here keeps everything pointed at the same place, rather than relying on whatever id Grafana would otherwise generate on its own.
Tells Grafana where to find dashboards
apiVersion: 1

providers:
  - name: Idako
    folder: Idako
    type: file
    updateIntervalSeconds: 30
    options:
      path: /etc/grafana/provisioning/dashboards
The dashboard itself
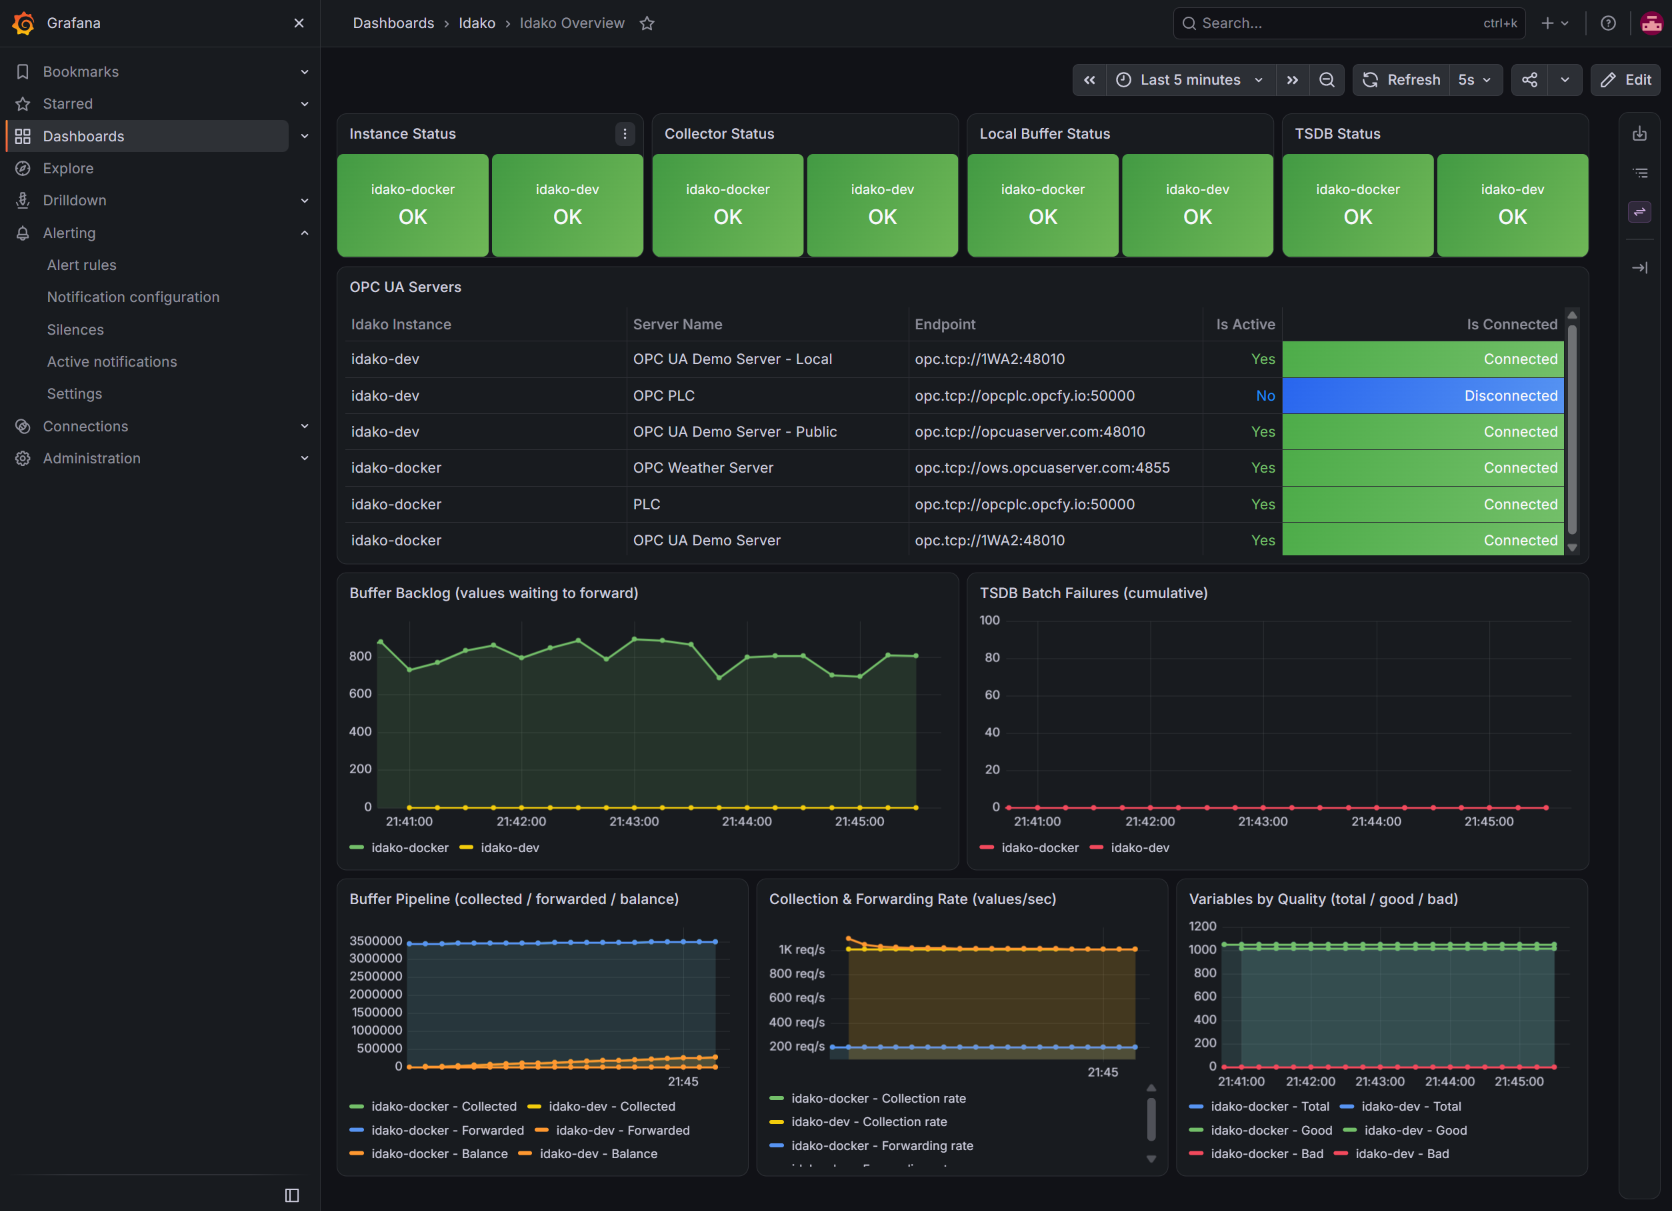
grafana/provisioning/dashboards/idako-overview.json — eleven panels covering every subsystem: instance, collector, local buffer, and tsdb status; connected/disconnected server counts; buffer backlog; tsdb batch failures; the buffer pipeline (collected/forwarded/balance); collection & forwarding rate; and variable quality (total/good/bad). Nothing to change here either, unless you want to customize it later:
{
  "title": "Idako Overview",
  "uid": "idako-overview",
  "schemaVersion": 39,
  "version": 4,
  "editable": true,
  "timezone": "browser",
  "time": { "from": "now-6h", "to": "now" },
  "refresh": "5s",
  "panels": [
    {
      "title": "Instance Status",
      "type": "stat",
      "gridPos": { "x": 0, "y": 0, "w": 4, "h": 6 },
      "datasource": { "type": "prometheus", "uid": "prometheus" },
      "targets": [{ "expr": "up{job=\"idako\"}", "refId": "A" }],
      "fieldConfig": {
        "defaults": {
          "mappings": [{ "type": "value", "options": {
            "0": { "text": "DOWN", "color": "red" },
            "1": { "text": "OK", "color": "green" }
          }}],
          "thresholds": { "mode": "absolute", "steps": [
            { "color": "red", "value": null }, { "color": "green", "value": 1 }
          ]}
        }, "overrides": []
      },
      "options": { "reduceOptions": { "calcs": ["lastNotNull"] }, "colorMode": "background", "graphMode": "none" }
    },
    {
      "title": "Collector Status",
      "type": "stat",
      "gridPos": { "x": 4, "y": 0, "w": 4, "h": 6 },
      "datasource": { "type": "prometheus", "uid": "prometheus" },
      "targets": [{ "expr": "idako_collector_up", "refId": "A" }],
      "fieldConfig": {
        "defaults": {
          "mappings": [{ "type": "value", "options": {
            "0": { "text": "DOWN", "color": "red" },
            "1": { "text": "OK", "color": "green" }
          }}],
          "thresholds": { "mode": "absolute", "steps": [
            { "color": "red", "value": null }, { "color": "green", "value": 1 }
          ]}
        }, "overrides": []
      },
      "options": { "reduceOptions": { "calcs": ["lastNotNull"] }, "colorMode": "background", "graphMode": "none" }
    },
    {
      "title": "Local Buffer Status",
      "type": "stat",
      "gridPos": { "x": 8, "y": 0, "w": 4, "h": 6 },
      "datasource": { "type": "prometheus", "uid": "prometheus" },
      "targets": [{ "expr": "idako_buffer_up", "refId": "A" }],
      "fieldConfig": {
        "defaults": {
          "mappings": [{ "type": "value", "options": {
            "0": { "text": "DOWN", "color": "red" },
            "1": { "text": "OK", "color": "green" }
          }}],
          "thresholds": { "mode": "absolute", "steps": [
            { "color": "red", "value": null }, { "color": "green", "value": 1 }
          ]}
        }, "overrides": []
      },
      "options": { "reduceOptions": { "calcs": ["lastNotNull"] }, "colorMode": "background", "graphMode": "none" }
    },
    {
      "title": "TSDB Status",
      "type": "stat",
      "gridPos": { "x": 12, "y": 0, "w": 4, "h": 6 },
      "datasource": { "type": "prometheus", "uid": "prometheus" },
      "targets": [{ "expr": "idako_tsdb_up", "refId": "A" }],
      "fieldConfig": {
        "defaults": {
          "mappings": [{ "type": "value", "options": {
            "0": { "text": "DOWN", "color": "red" },
            "1": { "text": "OK", "color": "green" }
          }}],
          "thresholds": { "mode": "absolute", "steps": [
            { "color": "red", "value": null }, { "color": "green", "value": 1 }
          ]}
        }, "overrides": []
      },
      "options": { "reduceOptions": { "calcs": ["lastNotNull"] }, "colorMode": "background", "graphMode": "none" }
    },
    {
      "title": "Connected Servers",
      "type": "stat",
      "gridPos": { "x": 16, "y": 0, "w": 4, "h": 6 },
      "datasource": { "type": "prometheus", "uid": "prometheus" },
      "targets": [{ "expr": "idako_collector_connected_servers", "refId": "A" }],
      "fieldConfig": { "defaults": { "color": { "mode": "thresholds" },
        "thresholds": { "mode": "absolute", "steps": [{ "color": "blue", "value": null }] } }, "overrides": [] },
      "options": { "reduceOptions": { "calcs": ["lastNotNull"] }, "graphMode": "none" }
    },
    {
      "title": "Disconnected Servers",
      "type": "stat",
      "gridPos": { "x": 20, "y": 0, "w": 4, "h": 6 },
      "datasource": { "type": "prometheus", "uid": "prometheus" },
      "targets": [{ "expr": "idako_collector_disconnected_servers", "refId": "A" }],
      "fieldConfig": { "defaults": { "color": { "mode": "thresholds" },
        "thresholds": { "mode": "absolute", "steps": [
          { "color": "green", "value": null }, { "color": "red", "value": 1 }
        ]} }, "overrides": [] },
      "options": { "reduceOptions": { "calcs": ["lastNotNull"] }, "graphMode": "none" }
    },
    {
      "title": "Buffer Backlog (values waiting to forward)",
      "type": "timeseries",
      "gridPos": { "x": 0, "y": 6, "w": 12, "h": 8 },
      "datasource": { "type": "prometheus", "uid": "prometheus" },
      "targets": [{ "expr": "idako_buffer_values_balance", "refId": "A" }],
      "fieldConfig": { "defaults": { "custom": { "drawStyle": "line", "lineWidth": 2, "fillOpacity": 15 },
        "color": { "mode": "palette-classic" } }, "overrides": [] },
      "options": { "legend": { "displayMode": "list", "placement": "bottom" }, "tooltip": { "mode": "single" } }
    },
    {
      "title": "TSDB Batch Failures (cumulative)",
      "type": "timeseries",
      "gridPos": { "x": 12, "y": 6, "w": 12, "h": 8 },
      "datasource": { "type": "prometheus", "uid": "prometheus" },
      "targets": [{ "expr": "idako_tsdb_batches_failed", "refId": "A" }],
      "fieldConfig": { "defaults": { "custom": { "drawStyle": "line", "lineWidth": 2, "fillOpacity": 15 },
        "color": { "fixedColor": "red", "mode": "fixed" } }, "overrides": [] },
      "options": { "legend": { "displayMode": "list", "placement": "bottom" }, "tooltip": { "mode": "single" } }
    },
    {
      "title": "Buffer Pipeline (collected / forwarded / balance)",
      "type": "timeseries",
      "gridPos": { "x": 0, "y": 14, "w": 8, "h": 8 },
      "datasource": { "type": "prometheus", "uid": "prometheus" },
      "targets": [
        { "expr": "idako_buffer_values_stored", "legendFormat": "Collected", "refId": "A" },
        { "expr": "idako_buffer_values_forwarded", "legendFormat": "Forwarded", "refId": "B" },
        { "expr": "idako_buffer_values_balance", "legendFormat": "Balance", "refId": "C" }
      ],
      "fieldConfig": {
        "defaults": { "custom": { "drawStyle": "line", "lineWidth": 2, "fillOpacity": 10 },
          "color": { "mode": "palette-classic" } },
        "overrides": [
          { "matcher": { "id": "byName", "options": "Balance" },
            "properties": [{ "id": "color", "value": { "mode": "fixed", "fixedColor": "orange" } }] }
        ]
      },
      "options": { "legend": { "displayMode": "list", "placement": "bottom" }, "tooltip": { "mode": "multi" } }
    },
    {
      "title": "Collection & Forwarding Rate (values/sec)",
      "type": "timeseries",
      "gridPos": { "x": 8, "y": 14, "w": 8, "h": 8 },
      "datasource": { "type": "prometheus", "uid": "prometheus" },
      "targets": [
        { "expr": "idako_collector_rate", "legendFormat": "Collection rate", "refId": "A" },
        { "expr": "idako_tsdb_values_forwarded_rate", "legendFormat": "Forwarding rate", "refId": "B" }
      ],
      "fieldConfig": { "defaults": { "custom": { "drawStyle": "line", "lineWidth": 2, "fillOpacity": 10 },
        "color": { "mode": "palette-classic" }, "unit": "reqps" }, "overrides": [] },
      "options": { "legend": { "displayMode": "list", "placement": "bottom" }, "tooltip": { "mode": "multi" } }
    },
    {
      "title": "Variables by Quality (total / good / bad)",
      "type": "timeseries",
      "gridPos": { "x": 16, "y": 14, "w": 8, "h": 8 },
      "datasource": { "type": "prometheus", "uid": "prometheus" },
      "targets": [
        { "expr": "idako_collector_all_variables", "legendFormat": "Total", "refId": "A" },
        { "expr": "idako_collector_good_variables", "legendFormat": "Good", "refId": "B" },
        { "expr": "idako_collector_bad_variables", "legendFormat": "Bad", "refId": "C" }
      ],
      "fieldConfig": {
        "defaults": { "custom": { "drawStyle": "line", "lineWidth": 2, "fillOpacity": 10 },
          "color": { "mode": "palette-classic" } },
        "overrides": [
          { "matcher": { "id": "byName", "options": "Total" },
            "properties": [{ "id": "color", "value": { "mode": "fixed", "fixedColor": "blue" } }] },
          { "matcher": { "id": "byName", "options": "Good" },
            "properties": [{ "id": "color", "value": { "mode": "fixed", "fixedColor": "green" } }] },
          { "matcher": { "id": "byName", "options": "Bad" },
            "properties": [{ "id": "color", "value": { "mode": "fixed", "fixedColor": "red" } }] }
        ]
      },
      "options": { "legend": { "displayMode": "list", "placement": "bottom" }, "tooltip": { "mode": "multi" } }
    }
  ]
}
idako_collector_server_up{server="Your Server Name"}.Set up email alerts
Three pieces, provisioned the same way as the dashboard: where to send email from, who receives it, and what conditions trigger it.
SMTP credentials — the one file you actually create yourself
Grafana needs real SMTP relay details to send anything, and that includes a password — which is exactly why it isn't part of the download. .env-example is the safe-to-share template already sitting in your folder; .env is the real file you make from it:
# Copy this file to .env before starting the stack:
#   cp .env-example .env
# Then fill in your real SMTP relay details below. .env is gitignored and
# stays local to this machine only — never commit real credentials to Git.

# Required for Grafana's email alerts to actually send. Use your
# organization's own SMTP relay, or a transactional email provider
# (SendGrid, Mailgun, Amazon SES, etc.)
GF_SMTP_ENABLED=true
GF_SMTP_HOST=smtp.example.com:587
GF_SMTP_USER=alerts@example.com
GF_SMTP_PASSWORD=your-smtp-password
GF_SMTP_FROM_ADDRESS=alerts@example.com
GF_SMTP_FROM_NAME=Idako Monitoring
cp .env-example .env
# then edit .env with a text editor and fill in your real values
.env
.env after the stack is already running? A plain docker compose restart grafana is not enough — Grafana's container keeps whatever environment it was originally created with. Use docker compose up -d --force-recreate grafana to actually pick up new values.Who receives the alerts
This file controls where alert emails go. The only change needed is the placeholder address:
apiVersion: 1

contactPoints:
  - orgId: 1
    name: idako-email
    receivers:
      - uid: idako-email-receiver
        type: email
        settings:
          addresses: you@example.com
          singleEmail: true
Replace you@example.com with your real recipient — a comma-separated list works if more than one person should be notified.
Routing — send everything to that one address
This tells Grafana to route every alert to the contact point above — nothing to change here:
apiVersion: 1

policies:
  - orgId: 1
    receiver: idako-email
    group_by: ["alertname"]
What triggers an alert
Six conditions, one per subsystem plus two data-quality checks. Every rule queries Prometheus directly and routes through the contact point above via the default policy:
apiVersion: 1

groups:
  - orgId: 1
    name: idako-alerts
    folder: Idako
    interval: 1m
    rules:
      - uid: idako-instance-not-ok
        title: Idako instance is not OK
        condition: C
        for: 2m
        labels:
          severity: critical
        annotations:
          summary: "Idako instance is not reachable (Prometheus scrape of the /health endpoint is failing)"
        noDataState: Alerting
        execErrState: Alerting
        data:
          - refId: A
            relativeTimeRange: { from: 300, to: 0 }
            datasourceUid: prometheus
            model:
              expr: up{job="idako"}
              instant: true
              intervalMs: 1000
              maxDataPoints: 43200
              refId: A
          - refId: C
            datasourceUid: "__expr__"
            model:
              type: threshold
              expression: A
              conditions:
                - evaluator:
                    type: lt
                    params: [1]
              refId: C

      - uid: idako-buffer-not-ok
        title: Local Buffer is down
        condition: C
        for: 2m
        labels:
          severity: critical
        annotations:
          summary: "Idako's local buffer subsystem is not running (idako_buffer_up is 0)"
        noDataState: Alerting
        execErrState: Alerting
        data:
          - refId: A
            relativeTimeRange: { from: 300, to: 0 }
            datasourceUid: prometheus
            model:
              expr: idako_buffer_up
              instant: true
              intervalMs: 1000
              maxDataPoints: 43200
              refId: A
          - refId: C
            datasourceUid: "__expr__"
            model:
              type: threshold
              expression: A
              conditions:
                - evaluator:
                    type: lt
                    params: [1]
              refId: C

      - uid: idako-tsdb-not-ok
        title: TSDB is down
        condition: C
        for: 2m
        labels:
          severity: critical
        annotations:
          summary: "Idako's connection to the time-series database is not OK (idako_tsdb_up is 0)"
        noDataState: Alerting
        execErrState: Alerting
        data:
          - refId: A
            relativeTimeRange: { from: 300, to: 0 }
            datasourceUid: prometheus
            model:
              expr: idako_tsdb_up
              instant: true
              intervalMs: 1000
              maxDataPoints: 43200
              refId: A
          - refId: C
            datasourceUid: "__expr__"
            model:
              type: threshold
              expression: A
              conditions:
                - evaluator:
                    type: lt
                    params: [1]
              refId: C

      - uid: idako-server-disconnected
        title: OPC UA server disconnected
        condition: C
        for: 2m
        labels:
          severity: warning
        annotations:
          summary: "OPC UA server {{ $labels.server }} ({{ $labels.endpoint }}) is disconnected"
        noDataState: OK
        execErrState: Alerting
        data:
          - refId: A
            relativeTimeRange: { from: 300, to: 0 }
            datasourceUid: prometheus
            model:
              expr: idako_collector_server_up
              instant: true
              intervalMs: 1000
              maxDataPoints: 43200
              refId: A
          - refId: C
            datasourceUid: "__expr__"
            model:
              type: threshold
              expression: A
              conditions:
                - evaluator:
                    type: lt
                    params: [1]
              refId: C

      - uid: idako-bad-variables
        title: Bad variables detected
        condition: C
        for: 2m
        labels:
          severity: warning
        annotations:
          summary: "{{ $values.A }} variable(s) are reporting bad quality"
        noDataState: Alerting
        execErrState: Alerting
        data:
          - refId: A
            relativeTimeRange: { from: 300, to: 0 }
            datasourceUid: prometheus
            model:
              expr: idako_collector_bad_variables
              instant: true
              intervalMs: 1000
              maxDataPoints: 43200
              refId: A
          - refId: C
            datasourceUid: "__expr__"
            model:
              type: threshold
              expression: A
              conditions:
                - evaluator:
                    type: gt
                    params: [0]
              refId: C

      - uid: idako-forwarding-behind-collection
        title: TSDB forwarding is falling behind collection
        condition: D
        for: 5m
        labels:
          severity: warning
        annotations:
          summary: "Forwarding rate is more than 10% slower than the collection rate — the buffer backlog is likely growing"
        noDataState: OK
        execErrState: Alerting
        data:
          - refId: A
            relativeTimeRange: { from: 300, to: 0 }
            datasourceUid: prometheus
            model:
              expr: idako_collector_rate
              instant: true
              intervalMs: 1000
              maxDataPoints: 43200
              refId: A
          - refId: B
            relativeTimeRange: { from: 300, to: 0 }
            datasourceUid: prometheus
            model:
              expr: idako_tsdb_values_forwarded_rate
              instant: true
              intervalMs: 1000
              maxDataPoints: 43200
              refId: B
          - refId: C
            datasourceUid: "__expr__"
            model:
              type: math
              expression: "($A - $B) / $A"
              refId: C
          - refId: D
            datasourceUid: "__expr__"
            model:
              type: threshold
              expression: C
              conditions:
                - evaluator:
                    type: gt
                    params: [0.1]
              refId: D
| Rule | Fires when | Severity |
|---|---|---|
| Idako instance is not OK | up{job="idako"} is 0 for 2m | critical |
| Local Buffer is down | idako_buffer_up is 0 for 2m | critical |
| TSDB is down | idako_tsdb_up is 0 for 2m | critical |
| OPC UA server disconnected | idako_collector_server_up is 0 for 2m — one alert per server, named in the email | warning |
| Bad variables detected | idako_collector_bad_variables > 0 for 2m | warning |
| TSDB forwarding is falling behind collection | forwarding rate < 90% of collection rate for 5m | warning |
up{job="idako"} and not a custom Idako metric? This is Prometheus's own, built-in signal for "could I reach this target at all" — it gets a fresh value on every single scrape attempt, success or failure, so it detects a fully unreachable instance within one scrape interval. A metric Idako itself produces (like idako_up) simply stops updating when Idako is unreachable, which is a much slower and less reliable way to notice a total outage.for duration to avoid paging on a blip; resolved notifications go out on the next evaluation after the condition clears, no equivalent delay.The Docker Compose file
docker-compose.yml wires everything together: Prometheus reads its config from step 2, Grafana reads its provisioning from steps 3–4 and its SMTP settings from .env, and both get a named volume so data survives a restart. Nothing to change here — it's already set up.
services:
  prometheus:
    image: prom/prometheus:latest
    container_name: idako-prometheus
    restart: unless-stopped
    volumes:
      - ./prometheus/prometheus.yml:/etc/prometheus/prometheus.yml:ro
      - prometheus-data:/prometheus
    ports:
      - "9090:9090"

  grafana:
    image: grafana/grafana:latest
    container_name: idako-grafana
    restart: unless-stopped
    depends_on:
      - prometheus
    volumes:
      - ./grafana/provisioning:/etc/grafana/provisioning:ro
      - grafana-data:/var/lib/grafana
    ports:
      - "3000:3000"
    env_file:
      - .env

volumes:
  prometheus-data:
  grafana-data:
.env must exist before this will start. env_file: - .env means Docker Compose refuses to start the grafana service if that file is missing — make sure step 4's cp .env-example .env happened first.Start the stack
From inside the idako-monitoring folder:
docker compose up -d
Confirm both containers are running:
docker compose ps
Then confirm Prometheus can actually reach Idako — open http://localhost:9090/targets in a browser. The idako target should show State: UP. If it shows DOWN, the error message next to it almost always names the problem — usually the host/port in step 2, or a firewall between the Docker host and Idako.
Open the dashboard
Go to http://localhost:3000 to sign in.
admin / admin. Grafana ships with this login out of the box and prompts you to set a real password the moment you sign in — do that immediately, especially if port 3000 is reachable from beyond your own machine.In the left menu, go to Dashboards — the Idako folder and the Idako Overview dashboard inside it were created automatically by the files from step 3. Open it — it should look like this:
Monitoring more than one Idako instance
Add one more entry to targets in prometheus/prometheus.yml — no changes needed anywhere else, including the dashboard and alert rules, since they already aggregate across whatever Prometheus is scraping:
    static_configs:
      - targets:
          - "idako-host-1:4880"
          - "idako-host-2:4880"
Restart Prometheus to pick up the change: docker compose restart prometheus.
Verifying the alerts actually work
A clean startup only proves Grafana accepted the SMTP settings, not that mail actually gets delivered. Two checks worth doing once, right after setup:
- Send a test email — in Grafana, go to Alerting → Contact points, open
idako-email, and use Test. This confirms your SMTP credentials and relay are correct in isolation, before any real alert depends on them. - Trigger a real one — stop Idako (or block the port) and wait a few minutes. "Idako instance is not OK" should reach Alerting → Active notifications within about 2–3 minutes, and land in your inbox shortly after. Bring Idako back and you should get a second, resolved email on the next evaluation.
docker exec idako-grafana printenv | grep GF_SMTP and compare against your current .env; if they differ, that's the --force-recreate step from earlier being skipped, not a credentials problem.Where to go from here
| More alert conditions | Add another rule to the same rules.yaml group — e.g. a warning specifically for a growing idako_buffer_values_balance, before it turns into lost data. |
| Route by severity | Add a second contact point (e.g. a chat webhook) and a policy that matches on the severity: critical label already set on three of the six rules, so only the urgent ones page immediately. |
| Distinguish "down" from "metrics are broken" | A blackbox_exporter container probing plain GET /health catches the narrower case where Idako is healthy but its Prometheus output specifically is malformed — up{job="idako"} alone can't tell those apart. |
| Keep history longer than Prometheus's default | Prometheus's local storage is fine for weeks of data; for longer retention, point it at a remote-write target instead of changing anything on the Idako side. |
| See exactly what Idako reports | The full field-by-field reference for /health, including every metric this dashboard and these alerts are built from. |